How I made a PII redaction model on Akamai Functions 4× faster, what surprised me along the way, and how I proved the output never changed.
Where I started
In the previous post, I got Desert Ant Labs’ redact model, a 23M-parameter int8 BERT token classifier, running as a Rust WebAssembly component on Akamai Functions (Fermyon Spin). It was correct, but a request spent ~1030 ms inside the app.
For a redaction service sitting in front of other requests, that’s too slow. This post follows the path to ~260 ms:
| Stage | Akamai (inside app) | Local |
|---|---|---|
| Start | ~1030 ms | ~1045 ms |
| Forward-pass rewrite | ~425 ms | ~290 ms |
| Precompiled tokenizer | ~357 ms | ~300 ms |
| Attention, GELU, quantisation work | ~260 ms | ~245 ms |
The rule I set myself
The output must not change. At all. Not “within tolerance”, but bit-identical logits for every real token. A PII redactor that quietly stops catching a surname after an optimisation is worse than a slow one.
This rule ruled out the usual shortcuts, including approximate exp, tanh-GELU, relaxed SIMD, a shorter window, and a smaller model. It shaped every technique below.
Part 1: Measure before touching anything
Guess #1 was wrong
My first guess was that the model is 22 MB and Spin creates a new instance per request, so loading the weights must be the problem. Maybe caching would help.
Instead of guessing, I added timers to every stage and returned them in a standard Server-Timing response header:
let [p_matmul, p_attn, p_other] = model::take_profile();
let timing = format!(
    "tok_load;dur={:.1}, model_load;dur={:.1}, encode;dur={:.1}, forward;dur={:.1};desc=\"{} window(s)\", \
     matmul;dur={:.1}, attention;dur={:.1}, other;dur={:.1}, total;dur={:.1}",
    tok_ms, load_ms, enc_ms, fwd_ms, windows, p_matmul, p_attn, p_other, total_ms,
);
eprintln!("[timing] {timing}");
// ...
.header("server-timing", timing)
Inside the forward pass, a tiny profiler adds elapsed time to one of three buckets: matmul, attention, and other. It measures at phase boundaries only, never in inner loops.
/// Time spent in `forward`, split by phase: [matmul, attention, other] in ms.
static mut PROFILE: [f64; 3] = [0.0; 3];

#[inline]
fn prof(slot: usize, t: std::time::Instant) -> std::time::Instant {
    let now = std::time::Instant::now();
    unsafe { PROFILE[slot] += (now - t).as_secs_f64() * 1000.0 };
    now
}
I also added a /ping route that returns before touching the tokenizer or model, to measure the instance start-up and network baseline on its own.
Now anyone can see the breakdown with curl:
curl -s -D - -o /dev/null -X POST https://<app>.fwf.app/redact \
     -H "Content-Type: application/json" -d '{"text":"..."}' | grep -i server-timing
One trivia moment: my first attempts printed nothing.
The first real numbers:
| Stage | Time |
|---|---|
| Model load | ~0.7 ms |
| Tokenizer setup | ~30 ms |
| Forward pass | ~1000 ms (matmul 818, attention 148, other 34) |
Loading weights took under a millisecond. With include_bytes! plus slices, there’s nothing to load. ~96% of the time was the forward pass. Caching the model couldn’t help, and a KV cache doesn’t apply to a single-pass encoder. The only way forward was making the maths faster.
A harness that makes “no change” provable
Before optimising, I needed a way to prove each change left the output alone. examples/eval.rs runs 10 varied texts, including names, addresses, credit cards, IBANs, IP addresses, French text, and a long paragraph, through the model and compares every real token’s logits with a committed baseline file, eval_baseline.bin:
accuracy vs baseline: label agreement 345/345 (100.00%), max |dlogit| 0.00e0, mean |dlogit| 0.00e0
  per forward: matmul 164.7 ms, attention 51.1 ms, other 28.7 ms
forward: median 239.5 ms, min 234.7 ms (50 runs)
max |dlogit| 0.00e0 is the bar. Anything else is a regression.
Part 2: The discovery that explained everything, epoch interruption
While building the harness, I ran it in plain wasmtime and got a confusing result:
| Runtime | Forward pass |
|---|---|
wasmtime run | 353 ms |
| Spin (same code) | ~1000 ms |
Same Wasm, same machine, 3× slower under Spin. Why?
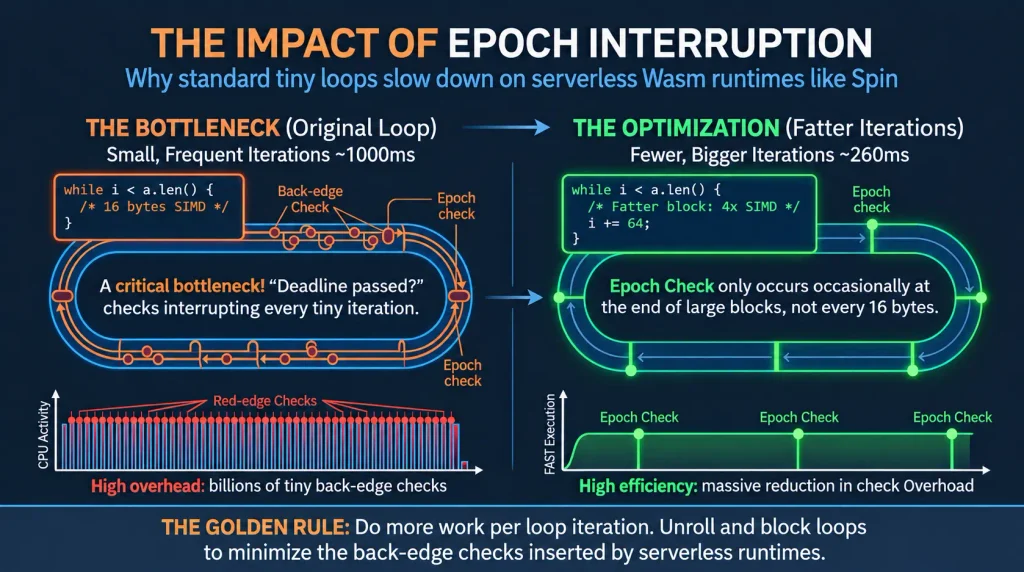
Spin needs to kill requests that run too long. Wasmtime supports this through epoch interruption: the compiler inserts a small check, “has the deadline passed?”, at every function entry and every loop back-edge. Normally that’s cheap. But my inner loops were tiny:
while i < a.len() {             // one back-edge check per 16 bytes
    let va = v128_load(...);
    let vb = v128_load(...);
    // 4 SIMD ops
    i += 16;
}
A 384-wide dot product is 24 iterations; the forward pass runs billions of them. The epoch check was a large fraction of each iteration.
Reproducing it outside Spin confirmed it:
wasmtime run                           eval.wasm   # 353 ms
wasmtime run -W epoch-interruption=y   eval.wasm   # 993 ms
So bench.sh always runs with epoch interruption on:
#!/bin/sh
# Accuracy + timing check under Spin-like runtime settings (epoch interruption on).
set -e
cd "$(dirname "$0")"
cargo build --release --target wasm32-wasip1 --example eval 2>&1 | grep -E "^(error|warning)" || true
exec wasmtime run -W epoch-interruption=y -W timeout=3600s --dir . \
     target/wasm32-wasip1/release/examples/eval.wasm "${1:-check}"
And it gave me the guiding rule for the rest of the project:
Do more work per loop iteration. Fewer, fatter iterations mean fewer epoch checks. Blocking, unrolling, and processing several rows at once all help twice: better data reuse and fewer back-edges.
Part 3: The forward-pass rewrite (~1000 → ~255 ms locally)
Step 1: Don’t compute what nobody reads (994 → 871 ms)
From the porting work I knew padding is load-bearing: the model attends over the full 256-token window, pads included, and removing them changes the logits. So padding must stay as keys and values in every layer.
But look at the last layer. Its outputs for padding positions go to the classifier and are then thrown away. Only the queries of real tokens matter there. So forward takes the number of live tokens, and layer 6 computes Q, attention, output projection, FFN, and classifier for those rows only, while K and V are still computed for all 256:
pub fn forward(&self, ids: &[u32], live: usize) -> Vec<f32> {
    // ...
    for (li, ly) in self.layers.iter().enumerate() {
        // Rows whose output this layer must produce.
        let m = if li + 1 == LAYERS { live } else { n };
        ly.q.gemm(&xq, &qscales, m, &mut q[..m * D]);   // only m query rows
        ly.k.gemm(&xq, &qscales, n, &mut k);            // all 256 keys
        ly.v.gemm(&xq, &qscales, n, &mut v);            // all 256 values
        // ... attention, O, FFN, LayerNorm over m rows
    }
}
For a typical 20-token sentence that removes most of one layer’s work. The harness excludes pad-row logits from comparison, since they’re no longer computed.
Step 2: Blocked int8 GEMM (871 → 297 ms)
The matrix multiply was 80% of the time. The old code did one dot_i8 per (token, output) pair:
for t in 0..tokens {
    for o in 0..out {
        y[t * out + o] = bias[o] + dot_i8(&xq[t..], &w[o..]) as f32 * s_in[t] * s_w[o];
    }
}
Every call reloads the input row, runs a 24-iteration loop, and does a horizontal sum at the end. Three changes:
- Quantise all input rows once, up front, instead of inside the loop.
- Register tiles: compute a block of 4 tokens × 2 output rows at once. Each input vector loaded is used twice, each weight vector four times, and there are 8 dot products per loop iteration instead of 1, meaning 8× fewer epoch checks.
- A better instruction: sign-extend int8 to i16 and use
i32x4_dot_i16x8, which multiplies and pair-adds in one instruction.
/// Register-tile shape for the int8 GEMM (tokens x output rows).
const TM: usize = 4;
const TN: usize = 2;

#[inline(always)]
fn tile<const M: usize, const N: usize>(a: &[i8], b: &[i8], k: usize) -> [[i32; N]; M] {
    use core::arch::wasm32::*;
    let mut acc = [[i32x4_splat(0); N]; M];
    let (pa, pb) = (a.as_ptr(), b.as_ptr());
    let mut i = 0;
    unsafe {
        while i < k {
            let mut al = [i32x4_splat(0); M];
            let mut ah = [i32x4_splat(0); M];
            for r in 0..M {
                let v = v128_load(pa.add(r * k + i) as *const v128);
                al[r] = i16x8_extend_low_i8x16(v);
                ah[r] = i16x8_extend_high_i8x16(v);
            }
            for c in 0..N {
                let v = v128_load(pb.add(c * k + i) as *const v128);
                let bl = i16x8_extend_low_i8x16(v);
                let bh = i16x8_extend_high_i8x16(v);
                for r in 0..M {
                    acc[r][c] = i32x4_add(
                        acc[r][c],
                        i32x4_add(i32x4_dot_i16x8(al[r], bl), i32x4_dot_i16x8(ah[r], bh)),
                    );
                }
            }
            i += 16;
        }
    }
    // one horizontal sum per tile element
    // ...
}
Why is this safe for accuracy? Integer addition is exact and associative. However I reorder or block the integer accumulation, the sum is the same. The only float step is dequantisation, and I kept its exact operation order:
// Same operation order as the reference: bias + acc * s_in * s_w.
self.bias[o] + (acc as f32) * scale_in * self.scale[o]
I tried tile shapes 2×4, 2×8, 8×2, 4×4, 4×8, and 8×4 locally, and 2×4, 2×2, 4×1, and 3×2 later on Akamai Function. 4×2 won everywhere. Bigger tiles run out of the 16 SIMD registers x86 has and start spilling. Unrolling the k loop ×2 gained nothing.
871 → 297 ms. The single biggest step.
Step 3: SIMD attention and my first accuracy failure (297 → 252 ms)
Attention is softmax(Q·Kᵀ / √d) · V per head. The natural way to vectorise Q·K is along the head dimension d (32 values): 4 lanes each sum 8 products, then combine.
I tried that. bench.sh reported 344/345 labels, meaning one label flipped. The cause: floating-point addition is not associative. Summing d = 0..31 in one sequence versus four interleaved partial sums gives slightly different roundings. Tiny, but enough to push one borderline token over a decision boundary.
The fix was to vectorise in a direction that doesn’t change any summation: across keys. Each lane handles a different key j, and within each lane the sum over d runs in exactly the original order. To make that a contiguous load, K is transposed once per layer into kt[h][d][j]:
for j in 0..n {
    for c in 0..D {
        kt[c * n + j] = k[j * D + c];
    }
}
Then 4 keys are scored at once, with the 32-step d loop fully unrolled by a macro, one back-edge per 4 keys instead of per multiply:
let kp = kt.as_ptr().add(j);
let mut acc = f32x4_splat(0.0);
macro_rules! step {
    ($($d:literal)*) => {$(
        let kv = v128_load(kp.add($d * n) as *const v128);        // keys j..j+4 at dim d
        acc = f32x4_add(acc, f32x4_mul(f32x4_splat(*qp.add($d)), kv));
    )*};
}
step!(0 1 2 3 4 5 6 7 8 9 10 11 12 13 14 15 16 17 18 19 20 21 22 23 24 25 26 27 28 29 30 31);
The P·V step is vectorised across the 32-wide head dimension. Each output element still accumulates over keys in order.
One more detail made this exact: WebAssembly has no fused multiply-add. f32x4_mul followed by f32x4_add rounds twice, just like scalar a * b + c. On a native target with FMA, the compiler could fuse one and not the other, and results would differ.
label agreement 345/345 (100.00%), max |dlogit| 0.00e0
297 → 252 ms, exact.
Deploying the rewrite
On Akamai Function, forward time dropped from 955 to ~355 ms, and total time dropped from ~1030 to ~425 ms.
The new breakdown on Akamai Function:
| Stage | ms |
|---|---|
| matmul | ~215 |
| attention | ~88 |
| tokenizer setup | ~60 |
| other | ~52 |
Tokenizer setup was now the third-largest cost.
Part 4: The tokenizer that rebuilt itself on every request (~425 → ~357 ms)
Because Spin creates a fresh instance per request, Tokenizer::from_bytes(TOKENIZER_JSON) ran every time. Profiling it showed:
- ~9 ms parsing the 2.3 MB
tokenizer.json - ~13 ms building a HashMap and a trie of 31,000 vocabulary pieces, inflated by epoch checks in all those small loops
That’s ~30 ms locally and ~60 ms on Akamai, spent on work whose result never changes.
Move the work to build time
A build script now reads tokenizer.json at compile time and writes two files:
unigram.bin: vocabulary scores, piece strings, and a byte trie, laid out flat so it can be used where it lies.tokenizer_slim.json: the original config with the vocabulary removed (~320 KB). Normaliser, pre-tokeniser, and post-processor still come from it because they’re cheap.
The trie is stored breadth-first, with each node’s children contiguous and sorted, so a lookup is a binary search over a byte slice:
"UGM1" | n u32 | n_nodes u32 | unk_id u32 | pad u32 | min_score f64
scores      n x f64
piece_off   (n + 1) x u32          piece i = bytes[piece_off[i]..piece_off[i+1]]
piece bytes
nodes       n_nodes x (child_start u32, child_count u32, id i32)   id -1 = none
labels      n_nodes x u8           byte on the edge into node j
A model that reads the blob in place
Now I have implemented the tokenizers::Model trait on top of the embedded blob. “Loading” is reading a header:
pub static UNIGRAM_BLOB: &[u8] = include_bytes!(concat!(env!("OUT_DIR"), "/unigram.bin"));

impl FastUnigram {
    pub fn new(blob: &'static [u8]) -> Self {
        assert_eq!(&blob[..4], b"UGM1", "bad unigram.bin");
        let n = u32_at(blob, 4) as usize;
        // ... compute section offsets, no allocation
    }

    /// Child of node `j` along byte `b`, if any.
    #[inline]
    fn child(&self, j: usize, b: u8) -> Option<usize> {
        let (start, count, _) = self.node(j);
        let labels = &self.blob[self.labels + start..self.labels + start + count];
        labels.binary_search(&b).ok().map(|k| start + k)
    }
}
The full pipeline plugs it in as a typed TokenizerImpl, so only the vocabulary step is replaced:
pub type FastTokenizer = tokenizers::TokenizerImpl<
    FastUnigram,
    tokenizers::NormalizerWrapper,
    tokenizers::PreTokenizerWrapper,
    tokenizers::PostProcessorWrapper,
    tokenizers::DecoderWrapper,
>;

pub fn load() -> Result<FastTokenizer> {
    Ok(serde_json::from_slice(TOKENIZER_SLIM_JSON)?)
}
Proving it’s identical
A tokenizer that differs on one rare input silently changes the model’s input. The Viterbi search in FastUnigram::encode mirrors Unigram::encode_optimized from tokenizers 0.20.4 line by line: shortest-prefix-first order, the strict > tie-break, the unknown-token penalty (K_UNK_PENALTY = 10.0), and fusing consecutive unknowns.
Then examples/tokcheck.rs compares both tokenizers on 40,003 texts (1.6 M tokens): random code points, CJK, emoji, fullwidth characters, a literal ▁, special tokens, and real PII samples. IDs, offsets, tokens, and masks must all match, and all 31k scores must be bit-identical.
To check that the check actually works, I mutated one character, changing > to >= in the tie-break, and confirmed tokcheck failed. It did.
Result: tok_load dropped from 34 to 1.8 ms locally and from ~60 to ~3 ms on Akamai. Total time dropped from ~425 to ~357 ms. The Wasm binary even shrank from 28.4 to 27.6 MB.
Part 5: Squeezing the kernels, one deployment at a time
From here I changed the process: every change got its own deployment to Akamai Function, and I measured a median over 20 requests. Local and Akamai Function numbers didn’t always agree.
Step 5: First, try tile shapes on Akamai’s CPUs
Akamai Function runs on x86; I’d tuned on Apple Silicon. I deployed 2×4, 2×2, 4×1, and 3×2 tiles. None beat 4×2. No change, but now I knew.
Step 6: Four query rows per attention pass (attention 89 → 71 ms)
In attention, each query row loaded all 256 keys and values. Processing 4 query rows together reuses each loaded K/V vector 4 times and shares every loop back-edge across 4 rows:
fn attention_rows<const R: usize>(q: &[f32], i0: usize, kt: &[f32], v: &[f32],
                                  off: usize, n: usize, scores: &mut [f32], ctx: &mut [f32]) {
    // ...
    let mut acc = [f32x4_splat(0.0); R];
    macro_rules! step {
        ($($d:literal)*) => {$(
            let kv = v128_load(kp.add($d * n) as *const v128);   // loaded once...
            for r in 0..R {                                     // ...used R times
                acc[r] = f32x4_add(acc[r], f32x4_mul(f32x4_splat(*qp.add(r * D + $d)), kv));
            }
        )*};
    }
    step!(0 1 2 3 4 5 6 7 8 9 10 11 12 13 14 15 16 17 18 19 20 21 22 23 24 25 26 27 28 29 30 31);
    // ...
}

const ATT_ROWS: usize = 4;
while i + ATT_ROWS <= m {
    attention_rows::<ATT_ROWS>(&q, i, kth, &v, off, n, &mut scores, &mut ctx);
    i += ATT_ROWS;
}
while i < m {                                         // leftover rows
    attention_rows::<1>(&q, i, kth, &v, off, n, &mut scores, &mut ctx);
    i += 1;
}
Each row’s operations and order are untouched, so it’s exact. I tried 2, 3, and 4 rows; 4 was fastest both locally and on Akamai Function. Akamai Function total dropped from ~357 to ~340 ms.
Step 7: SIMD GELU and a fast path that didn’t pay (other 49 → 46 ms)
The FFN applies GELU to 256 × 1536 values per layer:
pub fn gelu(x: f32) -> f32 {
    0.5 * x * (1.0 + libm::erff(x * FRAC_1_SQRT_2))
}
An approximate GELU would change output, so I looked inside libm::erff, a port of FreeBSD’s s_erff.c. It has several branches by |u|. Two of them, 2⁻²⁸ ≤ |u| < 0.84375 and 0.84375 ≤ |u| < 1.25, are pure rational polynomials: only adds, multiplies, and one divide, with no exp. Those can run 4 lanes at a time with exactly the same f32 constants and operation order:
// |u| < 0.84375: erf = u + u * (r / s)
let z = mul(u, u);
let r = add(c(PP0), mul(z, add(c(PP1), mul(z, add(c(PP2), mul(z, add(c(PP3), mul(z, c(PP4)))))))));
let s = add(one, mul(z, add(c(QQ1), mul(z, add(c(QQ2), mul(z, add(c(QQ3), mul(z, add(c(QQ4), mul(z, c(QQ5)))))))))));
let erf_a = add(u, mul(u, f32x4_div(r, s)));

// 0.84375 <= |u| < 1.25: erf = +-(1 - ((1 - ERX) - p / q))
let sv = f32x4_sub(ix, one); // ix bits == |u|
let pv = /* PA0..PA6 polynomial */;
let qv = /* QA1..QA6 polynomial */;
let y = f32x4_sub(one, f32x4_sub(c(1.0 - ERX), f32x4_div(pv, qv)));
let erf_b = v128_bitselect(f32x4_neg(y), y, neg);

let in_a = u32x4_lt(ix, u32x4_splat(0x3f58_0000));   // |u| < 0.84375, as bits
let erf = v128_bitselect(erf_a, erf_b, in_a);
let g = mul(mul(c(0.5), x), add(one, erf));
Branch boundaries are compared as integer bit patterns, exactly like the C code does, so there’s no float-comparison edge case.
First version: no gain. It used the SIMD result only when all 4 lanes were in range; otherwise, it ran scalar for the whole group. I measured 69% of individual values in range, but only 26% of 4-value groups. Most groups fell back entirely.
Fix: fall back per lane. Store the SIMD result, then patch only the out-of-range lanes with the scalar function:
// Lanes outside [2^-28, 1.25) (incl. NaN/inf) take the scalar path
// on their original input.
let ok = v128_and(
    u32x4_ge(ix, u32x4_splat(0x3180_0000)),
    u32x4_lt(ix, u32x4_splat(0x3fa0_0000)),
);
let mut bad = !i32x4_bitmask(ok) & 0xf;
v128_store(p.add(i) as *mut v128, g);
while bad != 0 {
    let l = bad.trailing_zeros() as usize;
    let xl = match l {
        0 => f32x4_extract_lane::<0>(x),
        1 => f32x4_extract_lane::<1>(x),
        2 => f32x4_extract_lane::<2>(x),
        _ => f32x4_extract_lane::<3>(x),
    };
    *p.add(i + l) = gelu(xl);
    bad &= bad - 1;
}
Checking all 4.3 billion inputs
“Same operations in the same order” is easy to claim and easy to get wrong. GELU takes one f32, so I can test every possible input: The geluchk logic runs all 2³² bit patterns, including NaNs, infinities, and subnormals, through both versions and compares the bits. In Wasm it takes about 30 seconds.
It found a bug on the first run. An early version recomputed the fallback lanes from the buffer after the SIMD store had already overwritten them. The fallback was computing gelu(gelu(x)). The model-level test didn’t notice because the effect was small and rare, but the exhaustive check did immediately. The fix is visible above: the fallback reads from the register x, not memory.
Akamai other 49 → 46 ms, total ~340 → ~336 ms. Small, but free.
Step 8: Quantise once, use three times (matmul 213 → 184 ms)
Looking at the layer code, Q, K, and V all consume the same LayerNorm output. Each matmul call quantised it again:
ly.q.matmul(&norm, m, &mut q, &mut xq);   // quantise norm
ly.k.matmul(&norm, n, &mut k, &mut xq);   // quantise norm again
ly.v.matmul(&norm, n, &mut v, &mut xq);   // and again
I split matmul into quantize_rows and gemm, then quantised once:
// Q, K and V read the same input: quantise it once. Row
// quantisation is independent per row, so Q can use the first m.
quantize_rows(&norm, n, D, &mut xq, &mut qscales);
ly.q.gemm(&xq, &qscales, m, &mut q[..m * D]);
ly.k.gemm(&xq, &qscales, n, &mut k);
ly.v.gemm(&xq, &qscales, n, &mut v);
Since quantisation is per row, Q, which in the last layer only needs the first m rows, gets exactly the same int8 values as before. Exact by construction.
Locally, matmul improved from ~195 to ~187 ms. Not much. On Akamai Function, matmul dropped from 213 to 184 ms, and total time from ~336 to ~307 ms. Four times the local gain. That was the hint for the next step: quantisation was much more expensive on Akamai’s x86 than on my laptop.
Step 9: Vectorising quantisation, rounding and NaN traps (matmul 184 → 140 ms)
Quantisation was still scalar:
let v = (xr[k] * inv).round();
q[k] = if v > 127.0 { 127 } else if v < -127.0 { -127 } else { v as i8 };
Vectorising it looks trivial. Two traps made it anything but trivial.
Trap 1: Wasm rounds differently
Wasm SIMD has f32x4_nearest, but it rounds half to even (2.5 → 2). Rust’s f32::round rounds half away from zero (2.5 → 3). Every x.5 would quantise differently.
So I emulated f32::round exactly:
round(v) = trunc(v) + (|v − trunc(v)| ≥ 0.5 ? copysign(1, v) : 0)
This is exact because v − trunc(v) is always exactly representable in f32; it just drops the integer bits. Therefore, the ≥ 0.5 comparison is never fooled by rounding.
Trap 2: NaN and argument order
Scalar code turns NaN into 0 (NaN as i8 == 0, and both comparisons are false). The SIMD clamp uses f32x4_pmin and f32x4_pmax, whose definition is pmin(a, b) = b < a ? b : a. If NaN is in b, the comparison is false and a is returned, the clamp bound, 127. If NaN is in a, NaN survives and the saturating convert turns it into 0.
My first version was pmin(hi, r). The exhaustive check reported:
MISMATCH at 210: x=NaN simd=127 scalar=0
Swapping the arguments fixed it. The final kernel:
let mut mv = f32x4_splat(0.0);
while k < inp {                                  // row max |x|, 16 values per iteration
    for u in 0..4 {
        let a = f32x4_abs(v128_load(xp.add(k + u * 4) as *const v128));
        mv = f32x4_pmax(mv, a);                  // order-independent; skips NaN like `>`
    }
    k += 16;
}
// ... horizontal max, scale computed in scalar exactly as before ...
while k < inp {
    let mut qi = [i32x4_splat(0); 4];
    for u in 0..4 {
        let v = f32x4_mul(v128_load(xp.add(k + u * 4) as *const v128), inv);
        let tr = f32x4_trunc(v);
        let away = f32x4_ge(f32x4_abs(f32x4_sub(v, tr)), half);
        // copysign(1, v): sign bit of v OR'd into 1.0
        let sgn = v128_or(f32x4_splat(1.0), v128_and(v, u32x4_splat(0x8000_0000)));
        let r = f32x4_add(tr, v128_and(away, sgn));
        // pmin(a, b) = b < a ? b : a, so NaN in `a` is kept.
        let r = f32x4_pmin(r, hi);
        let r = f32x4_pmax(r, lo);
        qi[u] = i32x4_trunc_sat_f32x4(r);
    }
    let h0 = i16x8_narrow_i32x4(qi[0], qi[1]);
    let h1 = i16x8_narrow_i32x4(qi[2], qi[3]);
    v128_store(qp.add(k) as *mut v128, i8x16_narrow_i16x8(h0, h1));   // 16 int8s at once
    k += 16;
}
The scalar version stays in the code as quantize_rows_scalar, as the reference.
the quantization logic checks it two ways:
- Exhaustive: rows whose max is exactly 127, so the scale factor is exactly 1.0 and each element is quantised as itself. This walks all 2³² f32 bit patterns through both versions.
- Random: 20,000 rows with scales from 2⁻²⁰ to 2²⁰, exact
.5ties, zeros, negative zeros, and all-zero rows.
Locally, forward time improved from ~263 to ~240 ms. On Akamai, matmul dropped from 184 to 140 ms, and total time from ~307 to ~260 ms. Again, about twice the local gain.
The full picture
| Step | Change | Akamai total | How I proved it exact |
|---|---|---|---|
| Original | Baseline | ~1030 ms | Baseline |
| 1 | Skip padding rows in the last layer | bench | |
| 2 | Blocked 4×2 int8 GEMM with i32x4_dot_i16x8 | Integer maths is exact | |
| 3 | SIMD attention, vectorised across keys | ~425 ms | bench (first try flipped a label) |
| 4 | Precompiled tokenizer | ~357 ms | tokcheck, 40k texts and mutation test |
| 5 | Other tile shapes on Akamai | No change | Benchmarking |
| 6 | 4 query rows per attention pass | ~340 ms | bench |
| 7 | SIMD GELU with per-lane fallback | ~336 ms | geluchk, all 2³² inputs |
| 8 | Quantise Q/K/V input once | ~307 ms | Exact by construction and bench |
| 9 | SIMD quantisation with exact rounding | ~260 ms | quantchk, all 2³² values and 20k rows |
Every step: 345/345 labels, max |Δlogit| = 0.
Where the ~260 ms goes now on Akamai:
| Stage | ms |
|---|---|
| Matrix multiply | ~140 |
| Attention | ~71 |
| Other (GELU fallback lanes, LayerNorm, residuals) | ~46 |
| Tokenizer and model setup | ~5 |
What didn’t work
Negative results saved me time later, so here they are:
| Idea | Why not |
|---|---|
| Cache the model / KV cache | Loading was 0.7 ms; single-pass encoder; no state between requests |
| Bigger or different GEMM tiles | 4×2 fastest on Apple Silicon and on Akamai x86 |
Unroll the GEMM k loop ×2 | No gain |
Q·K reduced across d in SIMD lanes | Changed float order; flipped 1 of 345 labels |
Fast approximate exp in softmax | Only ~9 ms, and output would change |
| tanh-approximate GELU | Output would change |
| All-or-nothing SIMD GELU fallback | Only 26% of groups qualify; no gain |
| Relaxed SIMD int8 dot product | Uses 7-bit operands; output would change |
| Shorter window (128 tokens) | Padding is load-bearing |
| Threads | Not available to Spin components |
Lessons
- Measure first. The obvious suspect, weight loading, cost 0.7 ms. A
Server-Timingheader is cheap to add and guided every decision after. - Know your runtime. Epoch interruption tripled the cost of tight loops. Benchmark with the same runtime settings as production, or your numbers lie.
- Do more work per loop iteration. Blocking, unrolling, and multi-row processing were the core of almost every win.
- Integers can be reordered; floats can’t. Reorganise integer accumulation freely. For floats, vectorise across independent outputs, never across a reduction.
- Match the reference’s semantics, not the textbook’s.
f32::roundis notf32x4_nearest.pmin‘s NaN handling depends on argument order.libmbranch boundaries are bit patterns. - Exhaustive tests are cheap for one-input functions. 2³² f32 values take ~30 seconds. They caught two bugs the model-level test missed.
- Test your tests. A deliberate mutation (
>→>=) provedtokcheckcould fail. - Always confirm on the target. Quantisation work saved ~75 ms on Akamai’s x86 but only ~30 ms on my laptop. I would have undervalued or skipped those steps if I’d trusted local numbers.
- Local timing is noisy. The same commit measured 252 ms and 296 ms on different days. Compare against a fresh run of the previous commit, not an old number.
- One change per deploy. Medians of 20 requests, with cold-start samples discarded. Slow, but every number in this post means something.
What’s next
The remaining ideas that keep the output bit-identical, including SIMD for LayerNorm’s element-wise parts, SIMD dequantisation in the GEMM, reading scales and biases in place, and allocating buffers once, are each worth maybe 5–15 ms.
Going meaningfully below ~250 ms would mean giving up bit-exactness: relaxed SIMD, a shorter window, or a smaller distilled model. Each would need a new accuracy evaluation.
For now, a 23M-parameter multilingual PII model redacts a sentence in about a quarter of a second on Akamai Functions, in a sandbox that can’t make a single outbound request, and it gives exactly the same answer it did on day one.
Written By

I’m an Enterprise Architect at Akamai Technologies with 15+ years of experience across mobile engineering, edge infrastructure, security, and AI systems. Having launched 45+ apps on the App Store and Play Store (iOS, Android, Flutter, React Native), I specialize in mobile SDK internals, Frida-based security, and high-concurrency edge runtimes like Akamai EdgeWorkers, Fermyon, and HarperDB. In the AI space, I focus on Agentic AI frameworks (LangGraph, MCP), WASM-based Edge AI guardrails, self-hosted LLM inference, and real-time voice pipelines.